BeamZ
Mode Sources and Monitors
We first launch a mode profile solved only at the center frequency, then repeat the straight-waveguide run with seven Chebyshev-sampled profiles selected through ModeSpec.num_freqs. This progression makes the broadband-source improvement directly visible. Finally, we reuse the broadband source for a simple width-step junction.
The simulation uses BEAMZ's Design and Material API with its structure-aware rectilinear auto grid, including the native nonuniform mode solve, launch, monitor colocation, and area-weighted modal projection paths.
Setup
Import BeamZ together with the numerical and plotting libraries. The finite-difference mode solver is included in BeamZ.
import os
import sys
from dataclasses import replace
from pathlib import Path

import matplotlib.pyplot as plt
import numpy as np
from IPython.display import display

import beamz as bz

test_mode = os.environ.get("BEAMZ_DOCS_TEST") == "1"
Geometry, Band, and Grid
The design is a silicon strip waveguide on a silica substrate with air above it. Coordinates are centered on the simulation domain, so the source and monitor planes can be placed with simple signed offsets along x.
As in the reference, the monitors record 17 frequencies uniformly spaced from freq0 - 2*fwidth to freq0 + 2*fwidth. Setting ModeSpec.num_freqs=7 makes the broadband source use seven Chebyshev profile frequencies inside freq0 +/- 1.5*fwidth. plane_size = (0, 3 um, 2 um) means the source and mode-monitor planes are normal to x; the zero-sized dimension defines the propagation axis. The full example uses 20 cells per material wavelength near the waveguide. GridSpec.auto refines the silicon interfaces and smoothly grades toward coarser cells away from the waveguide. The mode eigensolver receives the exact transverse edge arrays, and monitor overlaps use the corresponding physical cell-area weights.
The full example keeps a 5 × 4 × 2 µm physical region and adds standard 12-cell CPML layers outside all six faces. Source and output planes remain at x = ±2 µm, with 0.5 µm clearance to the absorbing layers. The physical-region boundaries are grid edges; the upper air padding uses the same cell spacing as the lower silica padding so each contains exactly 12 cells.
# Define the unit length as micrometer
um = bz.um

# Height and width of the waveguide
wg_height = 0.22 * um
wg_width = 0.45 * um

# Permittivity of waveguide and substrate
si_eps = 3.48**2
sio2_eps = 1.45**2

# Free-space wavelength and frequency (in Hz)
lambda0 = 1.55 * um
freq0 = bz.LIGHT_SPEED / lambda0
fwidth = freq0 / 10

# Monitor 17 frequencies across +/- 2 fwidth.
# The broadband source itself uses 7 Chebyshev profiles across +/- 1.5 fwidth.
nfreqs = 3 if test_mode else 17
freqs = np.linspace(freq0 - 2 * fwidth, freq0 + 2 * fwidth, nfreqs)
lambdas_um = bz.LIGHT_SPEED / freqs / um
fcent_ind = nfreqs // 2

# Keep the physical region fixed and add 12 CPML cells outside each face.
mode_grid_steps = 4 if test_mode else 20
pml_cells = bz.PML.DEFAULT_CELLS
physical_size = tuple(value * um for value in ((5.0, 4.0, 3.0) if test_mode else (5.0, 4.0, 2.0)))
# The outer x cells contain silicon; the y and lower-z cells contain silica.
padding_spacing = lambda0 / (mode_grid_steps * np.sqrt([si_eps, sio2_eps, sio2_eps]))
# Fit an integer number of silicon cells across the physical x span.
padding_spacing[0] = physical_size[0] / np.ceil(physical_size[0] / padding_spacing[0])
pml_padding = pml_cells * padding_spacing
sim_size = tuple(np.asarray(physical_size) + 2 * pml_padding)
src_x = (-0.8 if test_mode else -2.0) * um
out_x = -src_x
plane_size = (0.0, 1.5 * um, 1.2 * um) if test_mode else (0.0, 3.0 * um, 2.0 * um)
run_time = 6 / freq0 if test_mode else 20 / fwidth
# Omitting thickness selects exactly 12 grid cells on each face.
boundaries = (bz.PML(formulation="cpml"),)

# Mode source and monitor specification
source_time = bz.GaussianPulse(
    freq0=freq0,
    fwidth=fwidth,
    offset=0.5 if test_mode else 4.0,
)
# Leave polarization unset so candidates retain descending-neff ordering.
# The fundamental source mode remains TE-like; setting polarization="te" here
# would reorder TE-like radiation candidates ahead of the former modes 1 and 2.
# This tutorial also inspects radiation/finite-window candidates. Keep the
# unrestricted basis explicitly rather than requiring every candidate to be
# confined to the injection aperture. The source still launches mode_index=0.
mode_spec = bz.ModeSpec(
    num_modes=1 if test_mode else 3,
    target_neff=0.98 * np.sqrt(si_eps),
    min_aperture_fraction=None,
)
broadband_profile_count = 3 if test_mode else 7

grid_spec = bz.GridSpec.auto(
    wavelength=lambda0,
    min_steps_per_wvl=mode_grid_steps,
    max_scale=1.25,
    snapping_points=(
        tuple(-0.5 * np.asarray(physical_size)),
        tuple(0.5 * np.asarray(physical_size)),
    ),
    # Match the upper air padding to the lower silica padding so both contain
    # exactly 12 cells while keeping the physical region centered at z=0.
    overrides=(bz.MeshOverride(
        center=(0.0, 0.0, 0.5 * (physical_size[2] + pml_padding[2])),
        size=(bz.inf, bz.inf, pml_padding[2]),
        dl=(None, None, padding_spacing[2]),
        enforced=True,
    ),),
)
Structures and Monitors
The straight reference simulation contains the substrate, the waveguide, and three monitors:
Monitorrecords the source-normalized frequency-domain field snapshotEy(x, y)at the central frequency.FluxMonitorcomputes the area-integrated Poynting flux through the output plane.ModeMonitordecomposes the same output-plane fields into forward and backward waveguide modes.
For a harmonic field, the signed power crossing a plane is
BEAMZ reports this in watts after source-spectrum normalization, matching the convention used by the modal amplitudes.
# Materials
mat_air = bz.Material(permittivity=1.0)
mat_wg = bz.Material(permittivity=si_eps)
mat_sub = bz.Material(permittivity=sio2_eps)

# Initialize air background
design = bz.Design(background=mat_air)

# Add the silica substrate
design += bz.Box(
    center=(0, 0, -0.5 * sim_size[2]),
    size=(bz.inf, bz.inf, sim_size[2]),
    material=mat_sub,
)

# Add the silicon waveguide
design += bz.Box(
    center=(0, 0, 0.5 * wg_height),
    size=(bz.inf, wg_width, wg_height),
    material=mat_wg,
)

# Source plane
src_plane = bz.Box(center=(src_x, 0, 0.0), size=plane_size)
field_mnt = bz.FieldMonitor(
    center=(0.0, 0.0, 0.5 * wg_height),
    size=(physical_size[0], physical_size[1], 0.0),
    freqs=[freq0],
    fields=("Ey",),
    name="field",
)
flux_mnt = bz.FluxMonitor(center=(out_x, 0, 0.0), size=plane_size, freqs=freqs, name="flux")
mode_mnt = bz.ModeMonitor(
    center=(out_x, 0, 0.0),
    size=plane_size,
    freqs=freqs,
    mode_spec=mode_spec,
    name="mode",
)
Build and Inspect the Straight Simulation
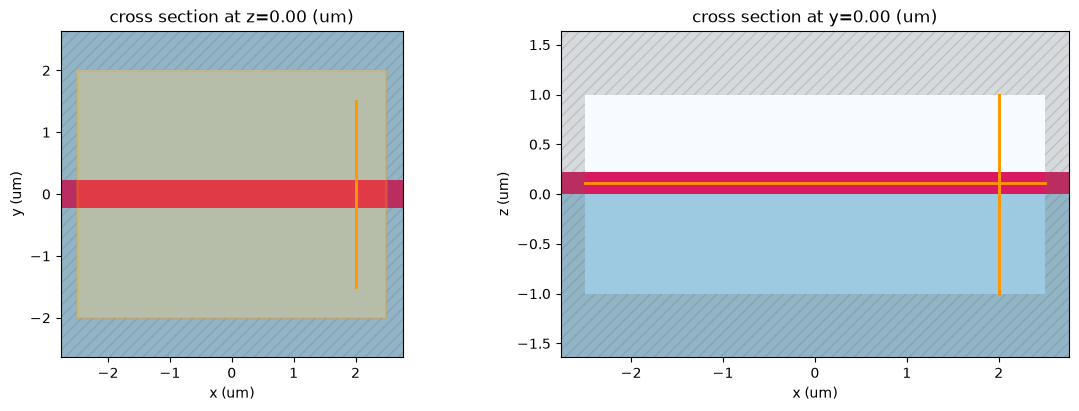
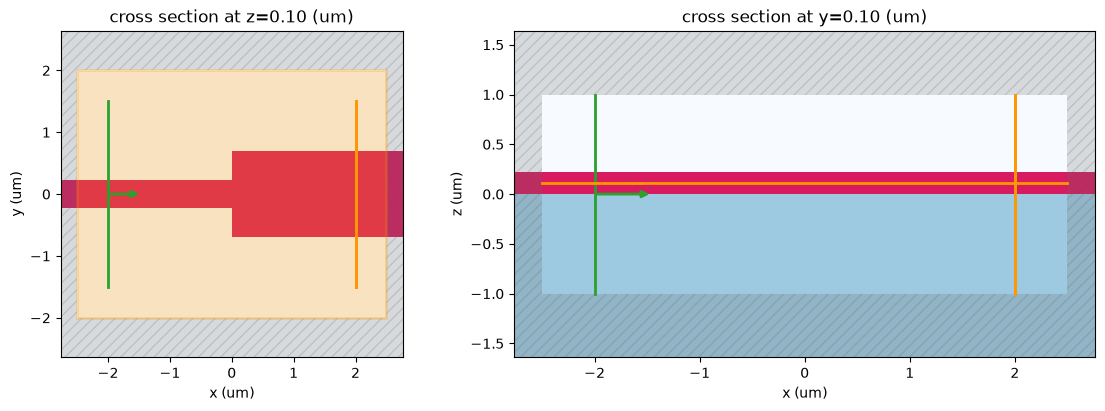
This first simulation has no source. It provides the geometry, realized rectilinear grid, and monitor planes used by the native ModeSource preview. The diagnostics below make the nonuniform mesh explicit by reporting each axis's cell count and spacing range. Plotting the cross sections is a quick check that the substrate, waveguide, source plane, and output monitor are where we expect them to be before running FDTD.
sim0 = bz.Simulation(
    domain=sim_size,
    grid_spec=grid_spec,
    design=design,
    sources=[],
    monitors=[field_mnt, flux_mnt, mode_mnt],
    boundaries=boundaries,
    run_time=run_time,
)
print(f"grid = {sim0.grid.metric_kind}, shape = {sim0.grid.shape}, steps = {sim0.num_steps}")
for axis in ("x", "y", "z"):
    spacing = sim0.grid.cell_widths(axis) / um
    print(f"  {axis}: {spacing.size} cells, dl = {spacing.min():.3f}..{spacing.max():.3f} um")

print("physical region (um):", np.asarray(physical_size) / um)
for axis, length in zip("xyz", physical_size):
    edges = getattr(sim0.grid, axis + "_edges") - sim0.coordinate_offset["xyz".index(axis)]
    np.testing.assert_allclose(edges[[pml_cells, -pml_cells - 1]], [-length / 2, length / 2], atol=1e-14, rtol=0)
print(f"CPML: {pml_cells} cells per face; padding (um):", pml_padding / um)

fig, axes = sim0.plot(z=0.0, y=0.0, show=False)
plt.show()
grid = rectilinear, shape = (249, 115, 69), steps = 24794 x: 249 cells, dl = 0.022..0.022 um y: 115 cells, dl = 0.021..0.053 um z: 69 cells, dl = 0.022..0.073 um physical region (um): [5. 4. 2.] CPML: 12 cells per face; padding (um): [0.26666667 0.64137931 0.64137931]
Solve Modes and Create the Center-Frequency Source
The native finite-difference mode solve finds fields of the form
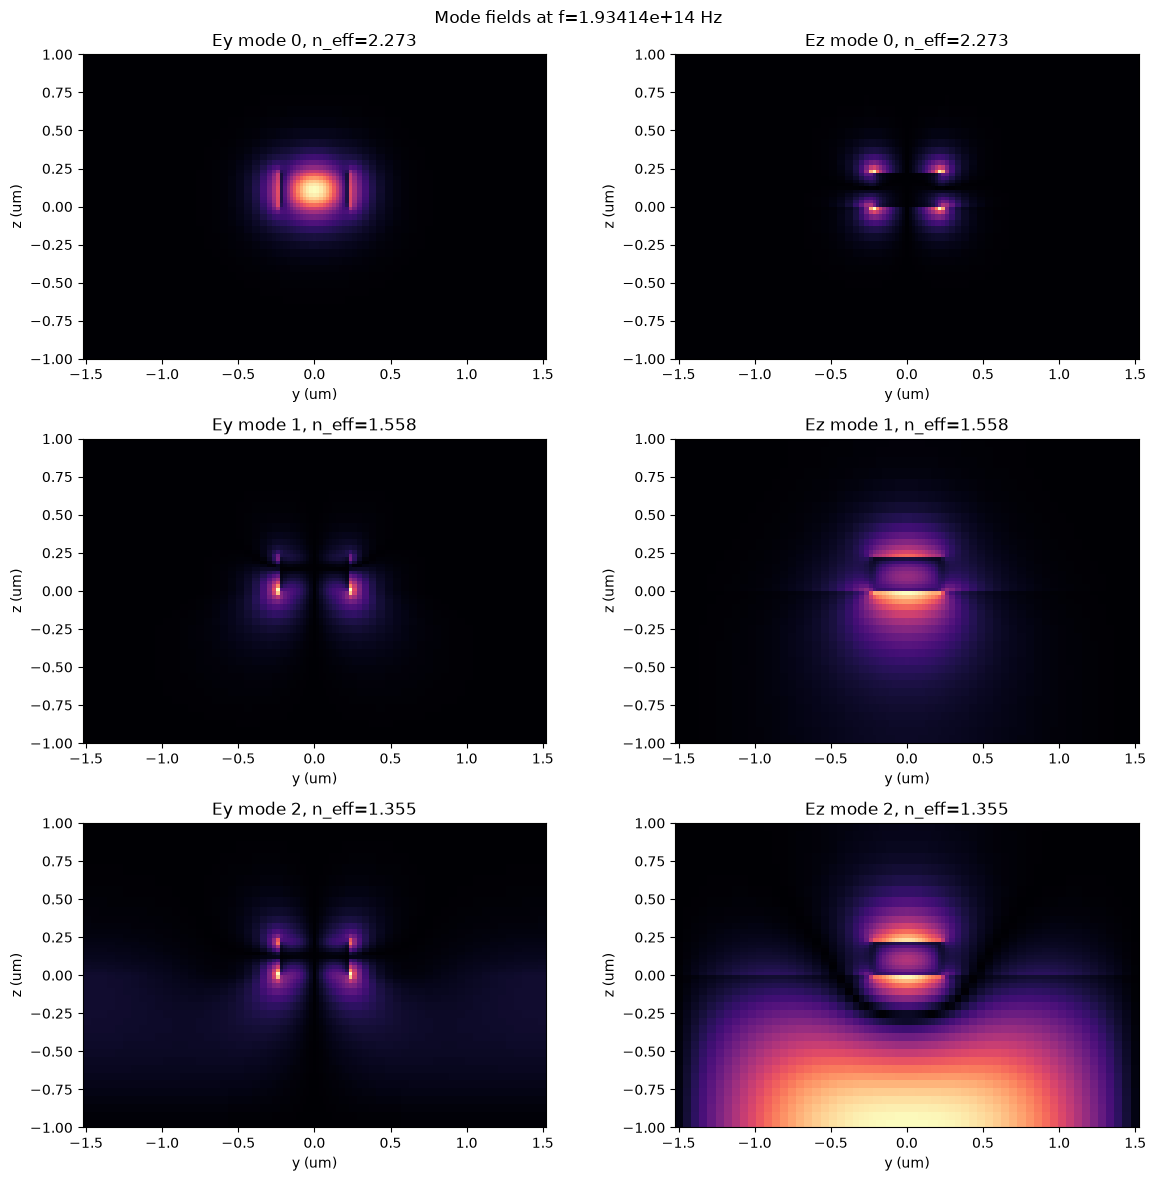
The table and field plots show all three requested eigensolver candidates. The plots use the stored transverse cell edges, so every colored rectangle occupies its true physical - area and the nonuniform spacing remains visible. Candidates below the substrate light line are radiation/finite-window modes rather than bound higher-order waveguide modes; the diagnostic below identifies them while retaining their profiles for inspection.
We convert the selected mode into a directional equivalent-current source. The selected mode is power-normalized so that, at the center frequency, the target launch power is
Here we inject the fundamental TE-like mode in the +x direction. The first source uses one profile at freq0, matching the first straight-waveguide run in the reference notebook.
mode_source_request = bz.ModeSource(
    center=src_plane.center,
    size=src_plane.size,
    direction="+",
    source_time=source_time,
    mode_spec=mode_spec,
)
modes = mode_source_request.solve_modes(sim0, freqs=[freq0])

from beamz.analysis import mode_data_to_dataframe
from beamz.analysis.plotting import plot_mode_field_components
mode_table = mode_data_to_dataframe(modes)
display(mode_table)

# A bound mode must lie above the highest surrounding-material light line.
cladding_neff = max(np.sqrt(mat_air.permittivity), np.sqrt(mat_sub.permittivity))
candidate_neffs = np.real(np.asarray(modes.neffs)[0])
candidate_mode_indices = tuple(range(candidate_neffs.size))
guided_mode_indices = tuple(
    int(index) for index in np.flatnonzero(candidate_neffs > cladding_neff + 1e-6)
)
if not guided_mode_indices:
    raise RuntimeError("No guided mode was found above the cladding light line.")
radiation_mode_indices = tuple(
    int(index) for index in np.flatnonzero(candidate_neffs <= cladding_neff + 1e-6)
)
if radiation_mode_indices:
    print(
        f"Candidate modes {radiation_mode_indices} are plotted for inspection, but "
        f"indices are at or below the cladding light line ({cladding_neff:.4g})."
    )

fig, axes, neffs = plot_mode_field_components(modes,
    field_names=("Ey", "Ez"),
    mode_indices=candidate_mode_indices,
    val="abs",
    f=freq0,
    figsize=(12, 4 * len(candidate_mode_indices)),
    show=False,
)
plt.show()

# The first run uses exactly one mode profile at freq0. The separate
# seven-frequency broadband reconstruction is constructed below.
mode_source_single = mode_source_request.updated_copy(
    mode_spec=replace(mode_source_request.mode_spec, num_freqs=1),
)
single_profile_freqs = mode_source_single.profile_frequencies()
np.testing.assert_allclose(single_profile_freqs, [freq0])
print("Single-profile frequency (THz):", single_profile_freqs[0] * 1e-12)
sim_single = sim0.updated_copy(sources=(mode_source_single,))
Candidate modes (2,) are plotted for inspection, but indices are at or below the cladding light line (1.45). Single-profile frequency (THz): 193.41448903225805 Mode 2 at 1.93414e+14 Hz does not decay at the solve boundaries (edge electric intensity fraction 0.0707). Enlarge the source/monitor aperture or set ModeSpec.solver_padding_cells explicitly.
| f | mode_index | wavelength | n eff | k eff | loss (dB/cm) | mode area |
|---|---|---|---|---|---|---|
| 1.934145e+14 | 0 | 1.55 | 2.273028 | 0.0 | 0.0 | 0.153616 |
| 1 | 1.55 | 1.558412 | 0.0 | 0.0 | 0.192564 | |
| 2 | 1.55 | 1.355261 | 0.0 | 0.0 | 0.520121 |
Center-Frequency Source: Straight Waveguide
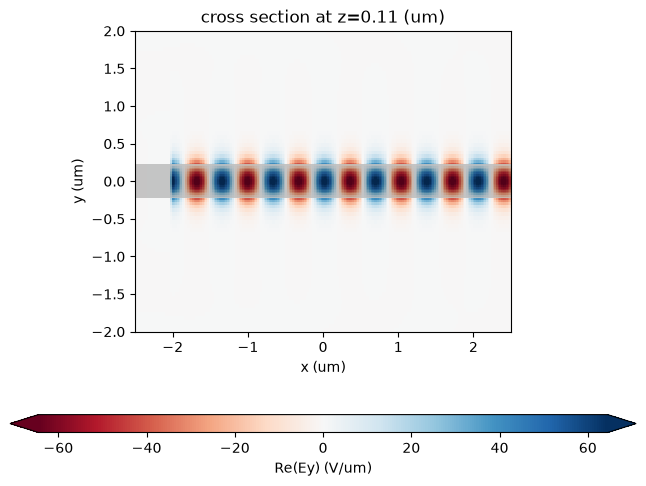
We first run the source whose spatial profile was solved only at freq0. The in-plane field plot is a frequency-domain DFT snapshot at freq0; BEAMZ source-normalizes this plot and displays electric fields in V/um.
The straight waveguide acts as a reference run: ideally nearly all power should remain in the forward fundamental mode, with very little backward power.
sim_data_single = sim_single.run(progress=True)
sim_data_single.plot_field("field", "Ey", frequency=freq0, val="real", cmap="RdBu", xlim=(-2.5, 2.5), ylim=(-2.0, 2.0), show_grid=False)
plt.show()
* Compiling simulation... Simulation runtime: 10.35 s GCUPS: 4.735
Center-Frequency Source: Power and Mode Decomposition
Mode source power, sampled flux, and squared modal amplitudes use the same discrete watts after monitor interpolation. Source-normalized results divide out the pulse spectrum. Only the raw pulse-weighted illustration uses an incident mode reference at the center frequency.
def scalar_power_scale(values, target_power, *, reference_index=None):
    """Return one scale using either a selected bin or the spectral peak."""
    spectrum = np.asarray(values, dtype=float)
    reference = float(np.max(spectrum) if reference_index is None else spectrum[reference_index])
    if not np.isfinite(reference) or reference <= 0.0:
        raise RuntimeError("Straight-waveguide reference power must be positive.")
    return float(target_power) / reference


flux_single_response = np.asarray(sim_data_single["flux"].flux, dtype=float)
mode_amps_single = sim_data_single.mode("mode")
coeffs_f_single = mode_amps_single.amps.sel(direction="+")
coeffs_b_single = mode_amps_single.amps.sel(direction="-")
single_power_scale = 1.0  # ModeSource and ModeMonitor already share modal watts.
flux_single = flux_single_response * single_power_scale
mode_power_f_single = mode_amps_single.power.sel(direction="+").values
mode_power_b_single = mode_amps_single.power.sel(direction="-").values

raw_single = sim_data_single.renormalize(None)
flux_single_raw = np.asarray(raw_single["flux"].flux, dtype=float)
mode_amps_single_raw = raw_single.mode("mode")
pulse_power_scale = scalar_power_scale(
    mode_amps_single_raw.power.sel(direction="+", mode_index=0).values,
    mode_source_single.power, reference_index=fcent_ind
)
flux_single_pulse = flux_single_raw * pulse_power_scale
mode_power_f_single_pulse = (
    np.abs(mode_amps_single_raw.amps.sel(direction="+").values) ** 2
    * pulse_power_scale
)
np.testing.assert_allclose(mode_power_f_single[fcent_ind, 0], mode_source_single.power, rtol=5e-3)
np.testing.assert_allclose(mode_power_f_single_pulse[fcent_ind, 0], mode_source_single.power, rtol=1e-12)

print("Peak sampled flux:", float(np.max(flux_single)))
print("Sampled flux at central frequency:", float(flux_single[fcent_ind]))
print("Pulse-weighted sampled flux at central frequency:", float(flux_single_pulse[fcent_ind]))
print("Power distribution at central frequency in first three modes")
print("  positive dir.", mode_power_f_single[fcent_ind])
print("  negative dir.", mode_power_b_single[fcent_ind])

# Protect both the source flux calibration and modal power normalization.
np.testing.assert_allclose(flux_single[fcent_ind], mode_source_single.power, rtol=5e-3)
np.testing.assert_allclose(mode_power_f_single[fcent_ind, 0], flux_single[fcent_ind], rtol=5e-4)


# Check the full spectrum: center-frequency agreement alone misses a mode
# refinement branch change near the long-wavelength end of this tutorial.
if not test_mode:
    np.testing.assert_allclose(mode_power_f_single[:, 0], flux_single, rtol=5e-3)
Peak sampled flux: 0.9999975994449218 Sampled flux at central frequency: 0.9999975994449218 Pulse-weighted sampled flux at central frequency: 1.0000003966569406 Power distribution at central frequency in first three modes ... Mode 2 at 2.17591e+14 Hz does not decay at the solve boundaries (edge electric intensity fraction 0.0782). Enlarge the source/monitor aperture or set ModeSpec.solver_padding_cells explicitly. Mode 2 at 2.22427e+14 Hz does not decay at the solve boundaries (edge electric intensity fraction 0.0717). Enlarge the source/monitor aperture or set ModeSpec.solver_padding_cells explicitly. Mode 2 at 2.27262e+14 Hz does not decay at the solve boundaries (edge electric intensity fraction 0.0545). Enlarge the source/monitor aperture or set ModeSpec.solver_padding_cells explicitly. Mode 2 at 2.32097e+14 Hz does not decay at the solve boundaries (edge electric intensity fraction 0.0157). Enlarge the source/monitor aperture or set ModeSpec.solver_padding_cells explicitly.
fig, axes = plt.subplots(1, 2, figsize=(11, 4), sharey=True)
for ax, title, total_power, mode0_power in (
    (axes[0], "Source-normalized response", flux_single, mode_power_f_single[:, 0]),
    (axes[1], "Pulse-weighted spectrum", flux_single_pulse, mode_power_f_single_pulse[:, 0]),
):
    ax.plot(lambdas_um, total_power, label="Sampled flux")
    ax.plot(lambdas_um, mode0_power, label="+x mode 0")
    ax.axhline(1.0, color="black", linewidth=0.8, alpha=0.5)
    ax.axvspan(
        bz.LIGHT_SPEED / (freq0 + 1.5 * fwidth) / um,
        bz.LIGHT_SPEED / (freq0 - 1.5 * fwidth) / um,
        color="black", alpha=0.08, label="future broadband design band",
    )
    ax.set_xlim([lambdas_um[-1], lambdas_um[0]])
    ax.set_xlabel("Wavelength (um)")
    ax.set_title(title)
    ax.legend(fontsize=8)
axes[0].set_ylabel("Power (W); 1 W incident modal reference")
fig.suptitle("Single-profile mode source")
fig.tight_layout()
plt.show()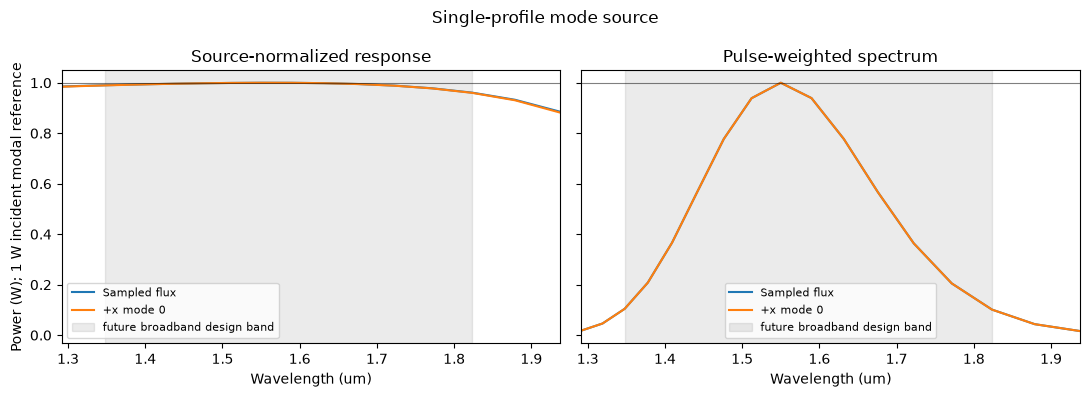
Broadband Mode Source: Chebyshev Profiles
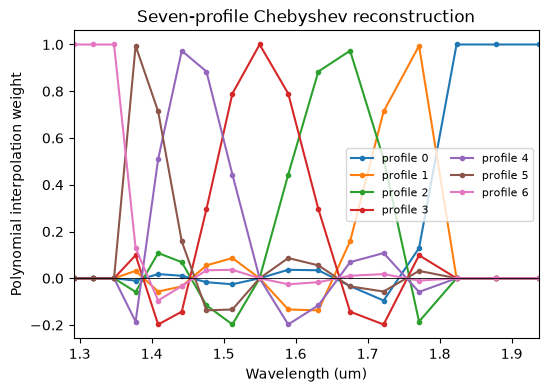
The broadband source uses seven frequency-dependent profiles. We set num_freqs on the source's immutable ModeSpec; BEAMZ derives the Chebyshev profile frequencies from the pulse center and width and reconstructs the frequency-dependent equivalent-current profile during compilation.
The plot below makes that interpolation explicit. The weights sum to one at every frequency, are cardinal at the seven solve frequencies, and can be negative between nodes—as expected for polynomial rather than piecewise-linear interpolation. Frequencies outside the sampled interval use the nearest end profile because broadband accuracy is only promised inside the shaded design band.
# Configure broadband reconstruction through ModeSpec, then inspect the
# exact public profile frequencies that ModeSource will compile.
mode_source_bb = mode_source_request.updated_copy(
    mode_spec=replace(
        mode_source_request.mode_spec, num_freqs=broadband_profile_count
    ),
)
profile_freqs = mode_source_bb.profile_frequencies()
profile_lambdas_um = bz.LIGHT_SPEED / profile_freqs / um


def barycentric_partition_weights(sample_freqs, nodes):
    """Return the polynomial partition associated with frequency nodes."""
    nodes = np.asarray(nodes, dtype=float)
    samples = np.clip(np.asarray(sample_freqs, dtype=float), nodes[0], nodes[-1])
    differences = nodes[:, None] - nodes[None, :]
    np.fill_diagonal(differences, 1.0)
    barycentric = 1.0 / np.prod(differences, axis=1)
    weights = np.empty((nodes.size, samples.size), dtype=float)
    for sample_index, sample in enumerate(samples):
        delta = sample - nodes
        exact = np.flatnonzero(
            np.isclose(delta, 0.0, rtol=0.0, atol=8 * np.finfo(float).eps * nodes[-1])
        )
        if exact.size:
            weights[:, sample_index] = 0.0
            weights[exact[0], sample_index] = 1.0
        else:
            values = barycentric / delta
            weights[:, sample_index] = values / values.sum()
    return weights


interp_weights = barycentric_partition_weights(freqs, profile_freqs)
cardinal_weights = barycentric_partition_weights(profile_freqs, profile_freqs)

np.testing.assert_allclose(interp_weights.sum(axis=0), 1.0, atol=1e-12)
np.testing.assert_allclose(cardinal_weights, np.eye(broadband_profile_count), atol=1e-12)
print("Chebyshev profile wavelengths (um):")
print(np.round(profile_lambdas_um, 6))
print("maximum partition-of-unity error:", np.max(np.abs(interp_weights.sum(axis=0) - 1.0)))

fig, ax = plt.subplots(figsize=(6, 4))
for index, weight in enumerate(interp_weights):
    ax.plot(lambdas_um, weight, marker=".", label=f"profile {index}")
ax.axhline(0.0, color="black", linewidth=0.6)
ax.set_xlim([lambdas_um[-1], lambdas_um[0]])
ax.set_xlabel("Wavelength (um)")
ax.set_ylabel("Polynomial interpolation weight")
ax.set_title("Seven-profile Chebyshev reconstruction")
ax.legend(ncol=2, fontsize=8)
plt.show()
Chebyshev profile wavelengths (um): [1.815497 1.755926 1.6579 1.55 1.455286 1.387304 1.352248] maximum partition-of-unity error: 2.220446049250313e-16
Broadband Mode Source: Straight Waveguide
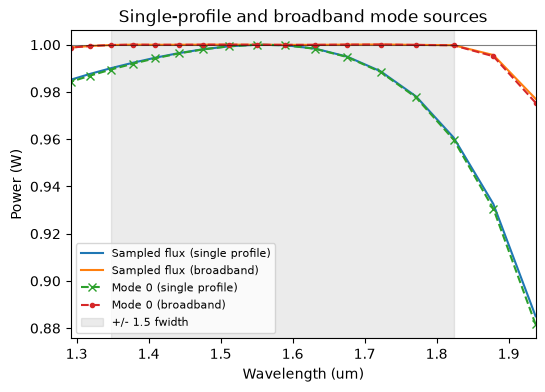
We rerun the straight guide with seven mode profiles and plot the library outputs directly. Finite bandwidth, aperture, and discretization errors remain visible.
sim_bb = sim0.updated_copy(sources=(mode_source_bb,))
sim_data_bb = sim_bb.run(progress=not test_mode)

flux_bb_response = np.asarray(sim_data_bb["flux"].flux, dtype=float)
mode_amps_bb = sim_data_bb.mode("mode")
coeffs_f_bb = mode_amps_bb.amps.sel(direction="+")
coeffs_b_bb = mode_amps_bb.amps.sel(direction="-")
bb_power_scale = 1.0
flux_bb = flux_bb_response * bb_power_scale
mode_power_f_bb = mode_amps_bb.power.sel(direction="+").values
mode_power_b_bb = mode_amps_bb.power.sel(direction="-").values

np.testing.assert_allclose(mode_power_f_bb[fcent_ind, 0], mode_source_bb.power, rtol=5e-3)
distance_from_center = np.abs(freqs - freq0)
design_band = (distance_from_center <= 1.5 * fwidth) | np.isclose(
    distance_from_center, 1.5 * fwidth, rtol=1e-12, atol=0.0
)

print("Broadband flux at central frequency:", float(flux_bb[fcent_ind]))
print("Broadband power distribution at central frequency")
print("  positive dir.", mode_power_f_bb[fcent_ind])
print("  negative dir.", mode_power_b_bb[fcent_ind])
print("Broadband mode-0 range in design band:",
      mode_power_f_bb[design_band, 0].min(), mode_power_f_bb[design_band, 0].max())

fig, ax = plt.subplots(figsize=(6, 4))
ax.plot(lambdas_um, flux_single, label="Sampled flux (single profile)")
ax.plot(lambdas_um, flux_bb, label="Sampled flux (broadband)")
ax.plot(lambdas_um, mode_power_f_single[:, 0], "x--", label="Mode 0 (single profile)")
ax.plot(lambdas_um, mode_power_f_bb[:, 0], ".--", label="Mode 0 (broadband)")
ax.axhline(1.0, color="black", linewidth=0.8, alpha=0.5)
ax.axvspan(
    bz.LIGHT_SPEED / (freq0 + 1.5 * fwidth) / um,
    bz.LIGHT_SPEED / (freq0 - 1.5 * fwidth) / um,
    color="black", alpha=0.08, label="+/- 1.5 fwidth",
)
ax.set_xlim([lambdas_um[-1], lambdas_um[0]])
ax.set_xlabel("Wavelength (um)")
ax.set_ylabel("Power (W)")
ax.set_title("Single-profile and broadband mode sources")
ax.legend(fontsize=8)
plt.show()

# Protect both the source flux calibration and modal power normalization.
np.testing.assert_allclose(flux_bb[fcent_ind], mode_source_bb.power, rtol=5e-3)
np.testing.assert_allclose(mode_power_f_bb[fcent_ind, 0], flux_bb[fcent_ind], rtol=5e-4)


# Compare modal watts with independently sampled flux at every frequency,
# including the design-band endpoints and the outer monitor samples.
if not test_mode:
    np.testing.assert_allclose(mode_power_f_bb[:, 0], flux_bb, rtol=2e-3)
* Compiling simulation... Simulation runtime: 10.62 s ... Broadband power distribution at central frequency positive dir. [1.00000215e+00 1.43669427e-17 2.45450440e-15] negative dir. [6.60814689e-10 3.64270460e-18 1.46284473e-16] Broadband mode-0 range in design band: 0.9997555354230155 1.0000932532823592
Flux and Modal-Power Accounting
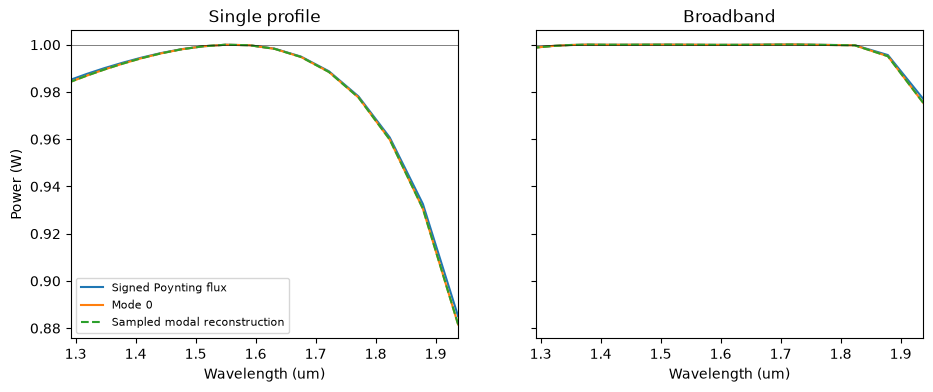
modal_flux reconstructs sampled power including overlap cross terms; unresolved_flux is the remaining measured flux. A finite modal basis can leave radiation and numerical error unresolved.
def power_accounting(label, flux, mode_data, power_forward, power_backward, power_scale):
    flux_values = np.asarray(flux, dtype=float)
    mode_monitor_flux = np.asarray(mode_data.flux.values, dtype=float) * power_scale
    net_guided = np.asarray(mode_data.modal_flux.values) * power_scale
    unresolved = np.asarray(mode_data.unresolved_flux.values) * power_scale
    center = fcent_ind

    print(label)
    print(f"  signed flux:              {flux_values[center]:.9f} W")
    print(f"  forward mode 0:           {power_forward[center, 0]:.9f} W")
    print(f"  sampled modal flux:       {net_guided[center]:.9f} W")
    print(f"  unresolved signed flux:  {unresolved[center]:.9f} W")
    print(f"  max flux-monitor difference: {np.max(np.abs(flux_values - mode_monitor_flux)):.3e} W")
    return net_guided, unresolved

net_guided_single, unresolved_single = power_accounting(
    "Single-profile source", flux_single, mode_amps_single,
    mode_power_f_single, mode_power_b_single, single_power_scale,
)
net_guided_bb, unresolved_bb = power_accounting(
    "Broadband source", flux_bb, mode_amps_bb,
    mode_power_f_bb, mode_power_b_bb, bb_power_scale,
)

fig, axes = plt.subplots(1, 2, figsize=(11, 4), sharey=True)
for ax, title, flux, mode0, net_guided in (
    (axes[0], "Single profile", flux_single, mode_power_f_single[:, 0], net_guided_single),
    (axes[1], "Broadband", flux_bb, mode_power_f_bb[:, 0], net_guided_bb),
):
    ax.plot(lambdas_um, flux, label="Signed Poynting flux")
    ax.plot(lambdas_um, mode0, label="Mode 0")
    ax.plot(lambdas_um, net_guided, "--", label="Sampled modal reconstruction")
    ax.axhline(1.0, color="black", linewidth=0.7, alpha=0.5)
    ax.set_xlim([lambdas_um[-1], lambdas_um[0]])
    ax.set_xlabel("Wavelength (um)")
    ax.set_title(title)
axes[0].set_ylabel("Power (W)")
axes[0].legend(fontsize=8)
plt.show()
Single-profile source signed flux: 0.999997599 W forward mode 0: 0.999997203 W sampled modal flux: 0.999997202 W ... forward mode 0: 1.000002148 W sampled modal flux: 1.000002147 W unresolved signed flux: 0.000000396 W max flux-monitor difference: 0.000e+00 W
Width-Step Junction
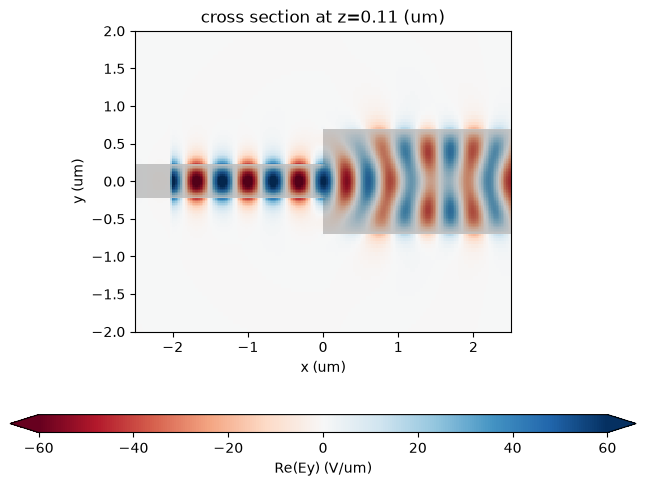
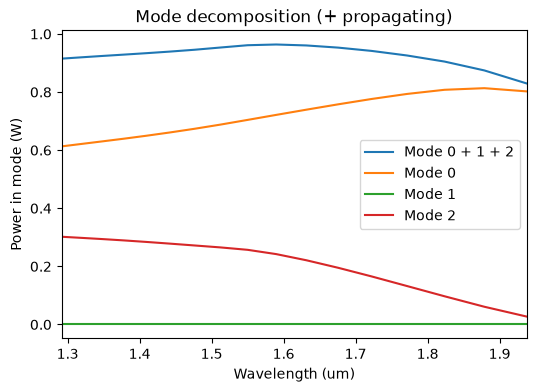
The junction variant keeps the broadband source and monitor definitions, but replaces the output half of the waveguide with a wider guide. This creates a simple discontinuity where the input mode can scatter into radiation and into several modes of the wider section. Using the matching broadband straight run as the reference avoids adding a fourth full simulation.
wgout_width = 1.4 * um
design_jct = design.with_structure(bz.Box(
    center=(0.25 * sim_size[0], 0, 0.5 * wg_height),
    size=(0.5 * sim_size[0], wgout_width, wg_height),
    material=mat_wg,
))

sim_jct0 = bz.Simulation(
    domain=sim_size,
    grid_spec=grid_spec,
    design=design_jct,
    sources=[],
    monitors=[field_mnt, flux_mnt, mode_mnt],
    boundaries=boundaries,
    run_time=run_time,
)
sim_jct_bb = sim_jct0.updated_copy(sources=(mode_source_bb,))
fig, axes = sim_jct_bb.plot(z=0.1 * um, y=0.1 * um, width_ratios=[1, 1.4], show=False)
plt.show()
sim_data_jct_bb = sim_jct_bb.run(progress=True)* Compiling simulation... Simulation runtime: 15.05 s GCUPS: 4.013
Junction Fields and Normalized Mode Powers
normalized_to uses the straight guide's forward incident fundamental mode as the common reference for amplitudes and flux. The mode powers need not sum to one because of reflection, radiation, unrepresented modes, and discretization error.
sim_data_jct_bb.plot_field("field", "Ey", frequency=freq0, val="real", cmap="RdBu", xlim=(-2.5, 2.5), ylim=(-2.0, 2.0), show_grid=False)
plt.show()

junction_modes = sim_data_jct_bb.mode("mode").normalized_to(
    mode_amps_bb, mode_index=0, direction="+", power=mode_source_bb.power
)
amps_jct_bb = junction_modes.amps.sel(direction="+")

fig, ax = plt.subplots(1, figsize=(6, 4))
ax.plot(lambdas_um, np.sum(np.abs(amps_jct_bb.values) ** 2, axis=1))
ax.plot(lambdas_um, np.abs(amps_jct_bb.values) ** 2)
ax.set_xlim([lambdas_um[-1], lambdas_um[0]])
ax.set_xlabel("Wavelength (um)")
ax.set_ylabel("Power in mode (W)")
ax.set_title("Mode decomposition (+ propagating)")
ax.legend(["Mode 0 + 1 + 2", "Mode 0", "Mode 1", "Mode 2"])
plt.show()